Disclaimer: this post was first drafted as a Stripe-internal email. On December 10, 2022 I republished it here, largely unchanged from the original. See Some Old Sorbet Compiler Notes for more. The Sorbet Compiler is still largely an experimental project: this post is available purely for curiosity’s sake.
Any benchmark numbers included in this post are intended to be educational about how the Sorbet Compiler approaches speeding up code. They should not be taken as representative or predictive of any real-world workload, and are likely out-of-date with respect to improvements that have been made since this post originally appeared.
The prompt for today’s post began as I asked myself, “Why is the Sorbet compiler slower than the interpreter for this benchmark?” But in asking this question (originally just out of curiosity), I accidentally nerd-sniped half my team into making some speedups.
Thus, this post continues an ongoing series looking into the performance of compiled Ruby. Previous posts in the series:
- Types Make Array Access Faster
- Another Look at Typed Array Access
- Fast While Loops in Ruby
- Instant Runtime Type Checks in Ruby
Unlike those posts (which mostly say, “look how much faster Ruby is when compiled!”), this post is about something the compiler is not great at (yet!).
Our agenda:
⏱ Introduce the benchmark, and measure it.
🔬 Profile the benchmark, and find (one part of) what’s slow.
🚀 Make it faster.
🤔 Close with some vague next steps.
Here’s our benchmark:
def returns_nilclass; nil; end

i = 0
while i < 10_000_000
  self.returns_nilclass
  i += 1
endIt’s got a method that does nothing, and we call it 10 million times.
The compiler is particularly fast with while loops (as I mentioned before), so we
subtract out time spent running the while loop when looking
at benchmarks:
| benchmark | interpreted | compiled |
|---|---|---|
| while_10_000_000.rb | 0.186s | 0.067s |
| returns_nilclass/no_sig.rb | 0.264s | 0.206s |
| returns_nilclass/no_sig.rb − while_10_000_000.rb | 0.078s | 0.139s |
The compiler is ~61 ms, or 78%, slower—that’s obviously not great. This 78% means that the compiler starts “in the hole” every time it does a method call. We’ve already seen previous posts showing specific things that the compiler can do faster than the interpreter, so getting a speed up in the real world means a method has to contain enough of those fast operations to pay off the “debt” of doing another method call.
I want to be clear now and say: our hypothesis is that there is no fundamental reason why this debt has to exist; merely: it does right now. Our claim is that we can speed up Ruby code as it occurs in real-world scenarios by compiling it.
At first, I was going to cut the post here, and say “yep, we haven’t won yet!” But I mentioned this slowness to my teammates, and we effectively sniped ourselves into making it better. This is what we did to make it faster.
Editor’s note: “7 lines of code” is a Stripe meme.
Our first step once the program is already this small—a mere 7 lines
of code 😎—is to
profile it with perf:
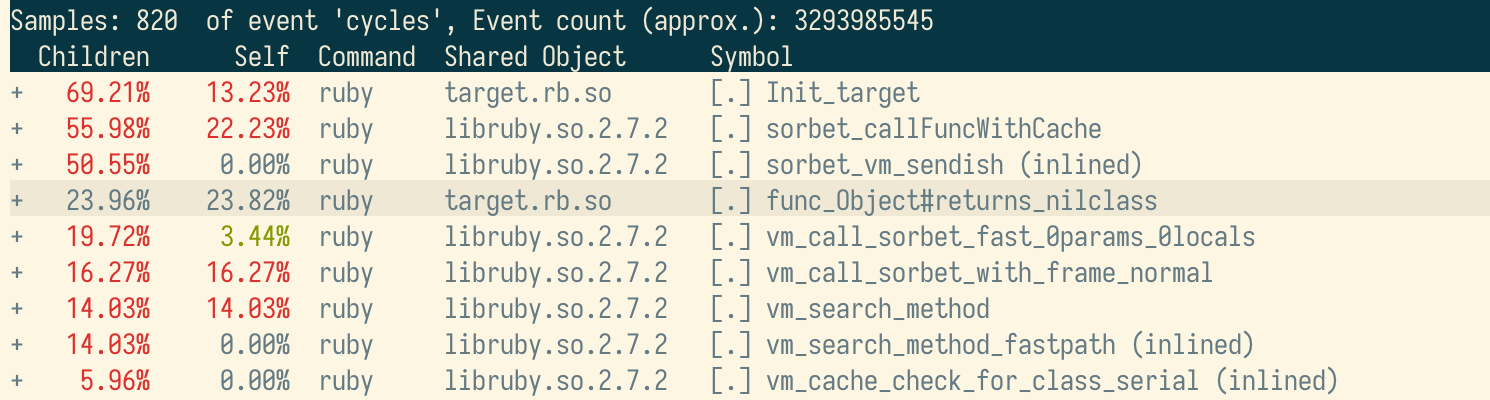
The heaviest entry by Self time is
func_Object#returns_nilclass. That’s the C function the
compiler emitted containing the code for our Ruby-level
returns_nilclass method above.
You’ll notice: we even emit debug info, mapping which Ruby-level line these instructions came from!
It means that if you run Ruby under gdb and print a
backtrace, sometimes you’ll see C files in the backtrace (from inside
the Ruby VM), and sometimes you’ll see Ruby files (for C functions
emitted by the Sorbet compiler).
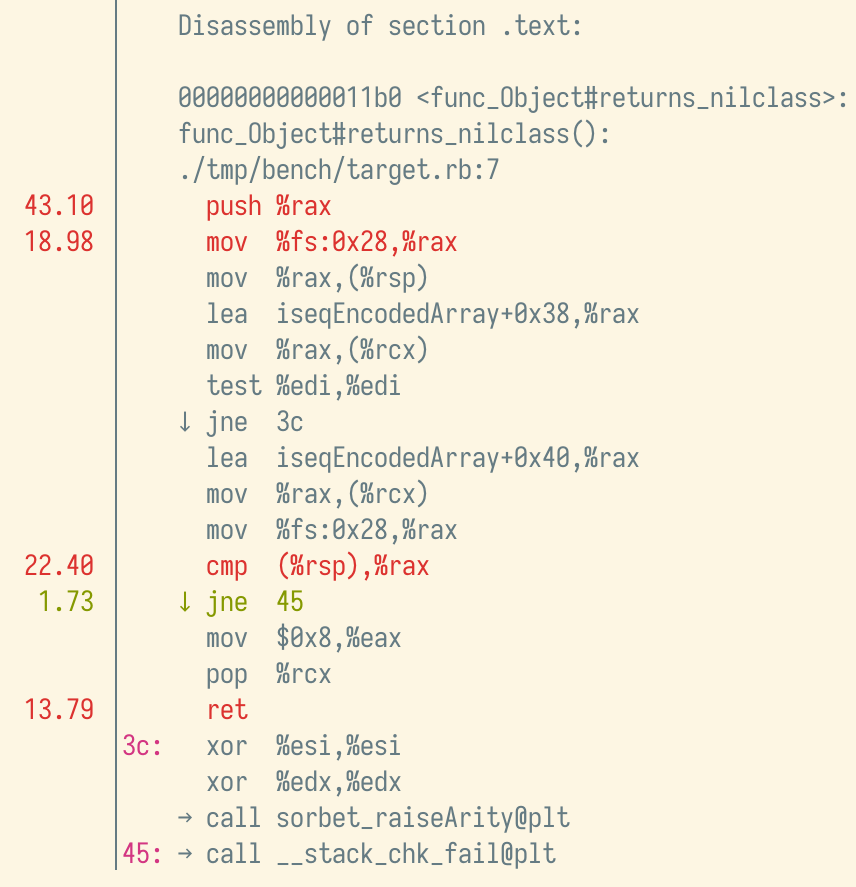
Perf lets us dig into an individual method’s assembly to see where the time is spent. Here’s the hot instructions:
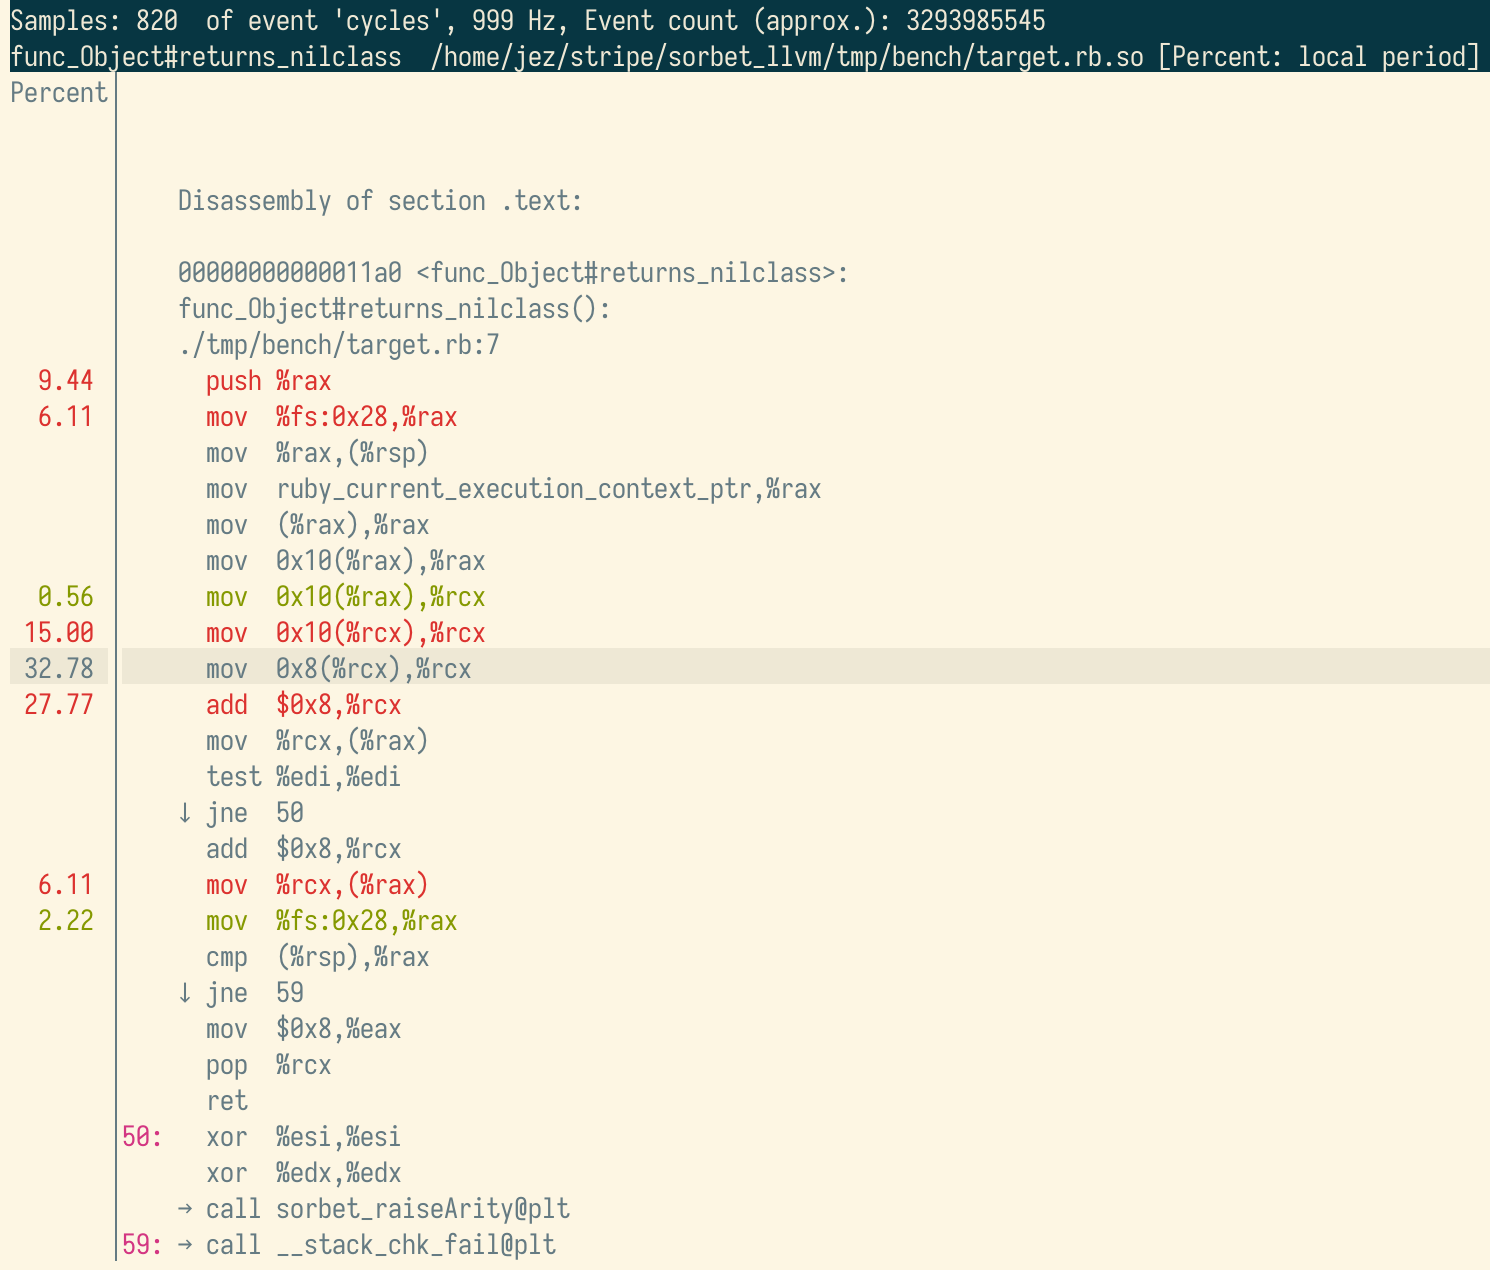
What immediately stands out is a long chain of mov
instructions at the top of the method, followed by an add.
In particular, you’ll notice these mov instructions all
look like:
mov smallNumber(%register1),%register2Comment from Nathan: “perf report -M intel ... ought to
use a more reasonable disassembly syntax.”
It’s super esoteric (thanks, AT&T
assembly
syntax),
but this means: take %register1, add
smallNumber to it, assume the result is an address, get the
value stored there and put it in %register2.
Sound familiar? That’s basically the assembly equivalent of
foo->bar in C. Start with foo
which is an address, add some number to get the address of the
bar field, and dereference to get the result. Since there’s
a bunch of these mov instructions in a row, we probably
have something like foo->bar->qux->zap.
Why is this slow? Bad cache locality. Chances are good that following any of those pointers means jumping to a completely different data structure stored in memory that’s not cached.
Skipping to the answer, these mov instructions came from
code in the Sorbet compiler designed to reach into one of the VM’s data
structures and pull out a field called iseq_encoded which,
among other things, is important for setting up line number information
for Ruby backtraces:
const VALUE *sorbet_getIseqEncoded(rb_control_frame_t *cfp) {
    return cfp->iseq->body->iseq_encoded;
}
→ Code here in codegen-payload.c
This code looks pretty much exactly like what we expected to find!
At this point, Trevor had an insight: we already know the contents of
that iseq_encoded field statically (because the compiler
allocated it earlier and stored the result in a known location). That
means we don’t even need this code at all. He put together a
PR implementing the change.
Then Nathan followed on with a similar
change, noticing that the compiled code was doing
ruby_current_execution_context_ptr->cfp in a bunch of
places where we could have instead passed cfp from the
caller.
After another perf run, there’s far less self time spent
in func_Object#returns_nilclass!
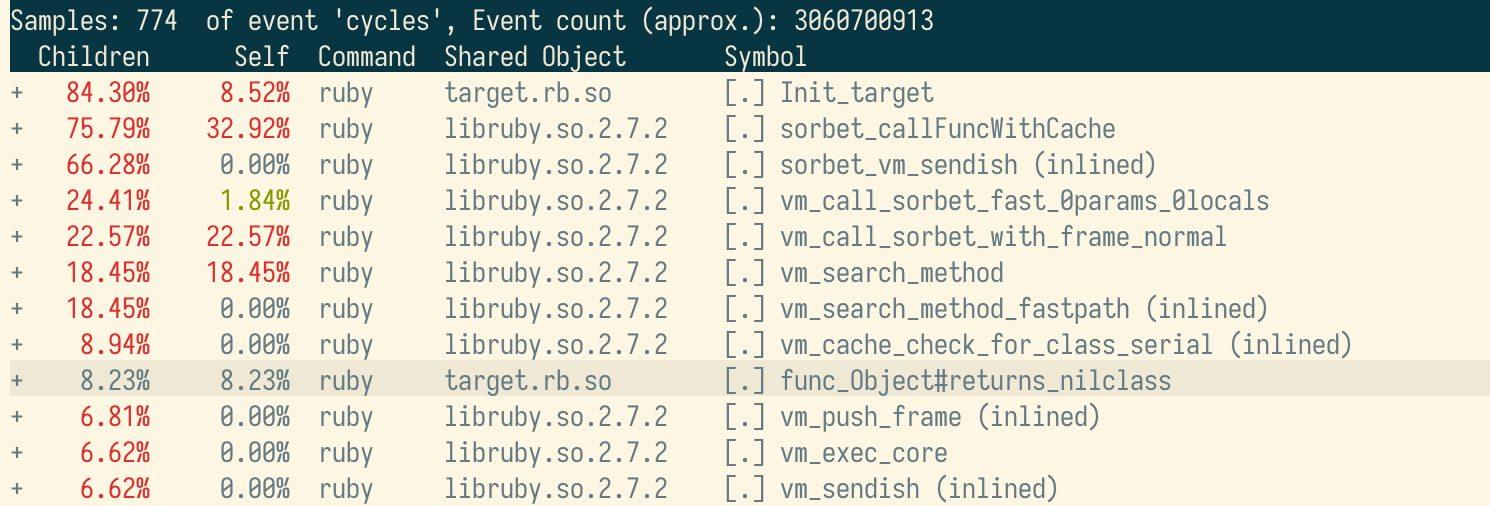
What took ~23.82% of self time before only takes ~8.23% now (making everything else take proportionally more time). If we dig into the assembly again, we notice two big differences:
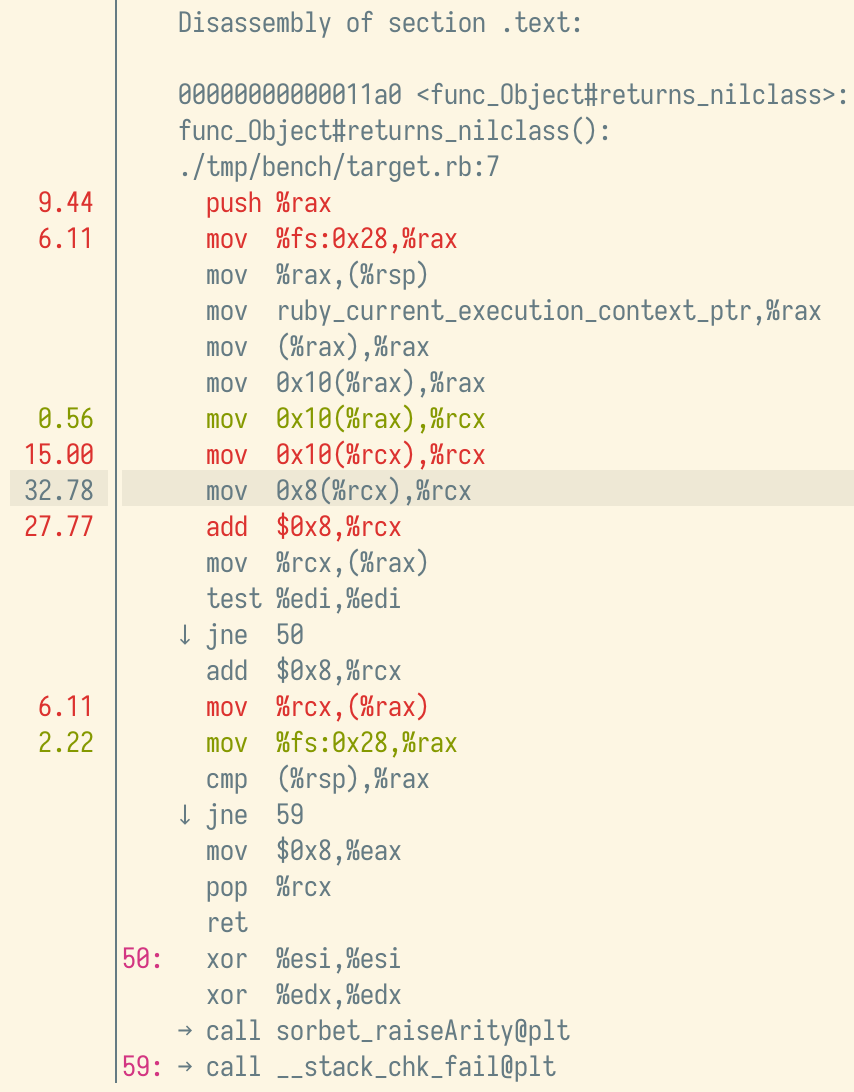
- The
movchain is gone, and has been replaced with a reference toiseqEncodedArray(a global variable holding theiseq_encodedthing that the compiler allocated). - The
ruby_current_execution_context_ptris gone, becausecfpis now passed from the caller as the fourth argument (unused, or we would see a mention of the%r9register).
But the real question: did it actually get faster? Or did we just shuffle the samples around? We can answer by running the benchmark again:
| benchmark | interpreted | compiled |
|---|---|---|
| returns_nilclass/no_sig.rb - baseline, before | 0.078s | 0.139s |
| returns_nilclass/no_sig.rb - baseline, after | 0.079s | 0.127s |
The compiled version speeds up by about 12 ms, or 8.6%, dropping the difference between compiled and interpreted from 78% slower to 60% slower. This is definitely good news, but maybe not quite as good as we would have hoped (the compiler is still slower than the interpreter). So what’s next?
At this point, nearly all the slowness comes from the call site, not the definition. Taking another look at the new perf output, we see that the heaviest methods by self time are now:
- 32.92% –
sorbet_callFuncWithCache- A Sorbet compiler method that gets ready to call back from compiled code into the VM.
- 22.57% –
vm_call_sorbet_with_frame_normal- A method that we’ve patched into the Ruby VM that makes calling Ruby C extension functions faster.
- 18.45% –
vm_search_method- A method in the Ruby VM that answers, “For a method with name
fooon valuex, what method entry do I call?”
- A method in the Ruby VM that answers, “For a method with name
These functions all happen before the
func_Object#returns_nilclass method is called. I’m sure
that we’ll dig into them as a team eventually, but for now, I don’t know
why they’re slow! But the process of finding out what’s wrong would look
the exact same:
- Profile and stare at the assembly to find the hot code.
- Have a stroke of insight to realize, “wait, we can just… not do
this”
- (or, more rare: “we need to do this, but it’s faster if we do it another way”).
- Repeat until it’s fast.
There are a handful of other places where we know the compiler isn’t quite up to snuff yet, and priority number one right now is to eliminate them so that we can deliver real performance wins with the Sorbet compiler in production.