I do the bulk of my code reviews from the command line, especially when reviewing larger changes. I’ve built up a number of tools and config settings that help me dig into the nuances of the code I’m reviewing, so that I can understand it better than if I were just browsing online.
In particular, I’ll walk through how I…
- check out the code in the first place,
- get a feel for what changed,
- visualize the relationships between the files that changed,
- bring up the code diffs in Vim,
- leverage the unique power of the editor and the terminal.
But first, let’s talk briefly about the point of code review in the first place.
Code review philosophy
When I ask that other people review my code, it’s an opportunity for me to teach them about the change I’ve just made. When I review someone else’s code, it’s to learn something from them. Some other benefits of code review include:
- Team awareness (to keep a pulse on what else is going on within your team).
- Finding alternative solutions (maybe there’s a small change that lets us kill two birds with one stone).
If this is different from how you think about code review, check out this talk. Code review is a powerful tool for learning and growing a team.
With that out of the way, let’s dive into the tools I use to maximize benefit I get from code review.
Checking out the code
The first step to reviewing code in the terminal is to check out the
code in the first place. One option is to simply to
git pull and then git checkout <branch>.
But if you happen to be using GitHub, we can get this down to just one
command:
hub pr checkout <pr-number>It works using hub, which
is a tool that exposes various features of GitHub from the command line.
If the pull request is from someone else’s fork, hub is
even smart enough to add their fork as a remote and fetch it.
At first glance
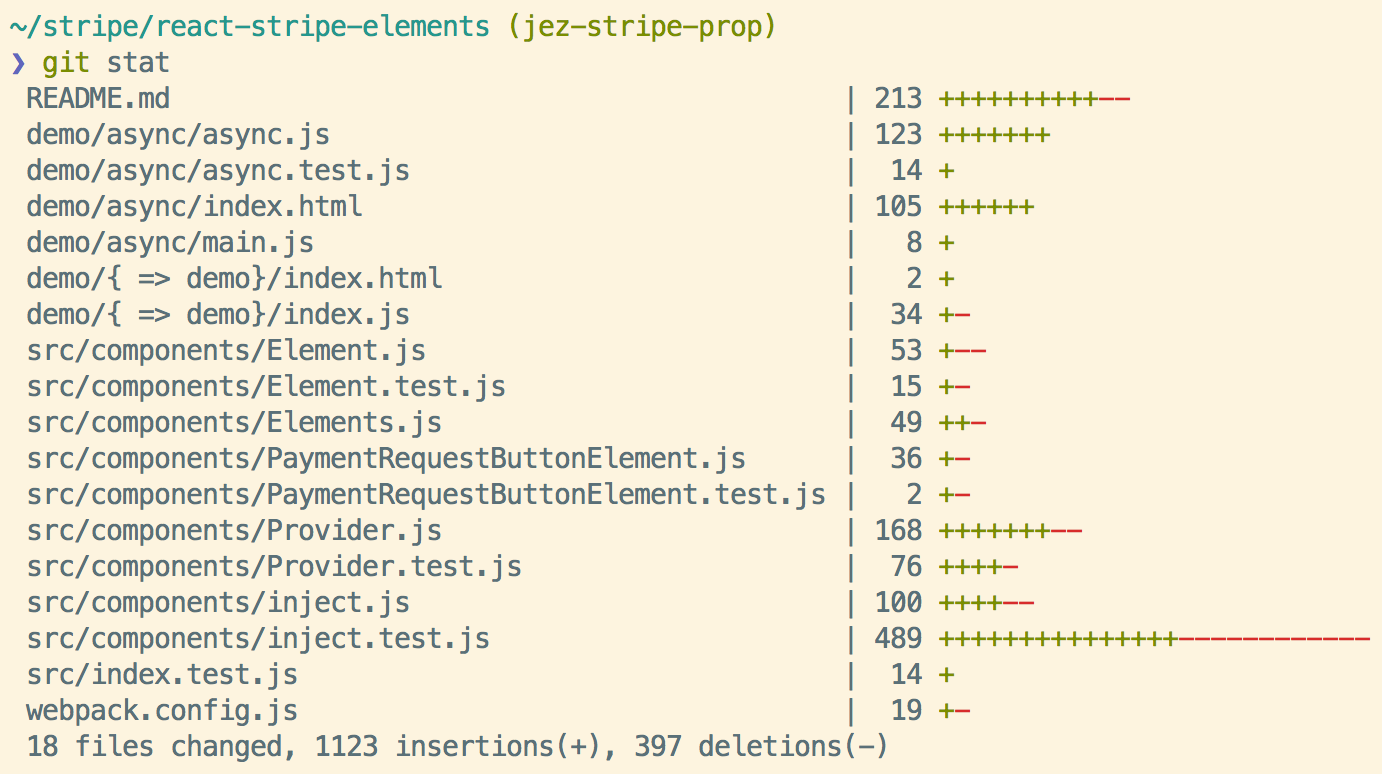
With the branch checked out locally, usually my next step is to get a feel for what changed. For this, I’ve written a git alias that shows:
- which files changed
- how many lines changed in each file (additions and deletions)
- how many lines changed overall
Here’s the definition of git stat from my
~/.gitconfig:
[alias]
    # list files which have changed since REVIEW_BASE
    # (REVIEW_BASE defaults to 'master' in my zshrc)
    files = !git diff --name-only $(git merge-base HEAD \"$REVIEW_BASE\")

    # Same as above, but with a diff stat instead of just names
    # (better for interactive use)
    stat = !git diff --stat $(git merge-base HEAD \"$REVIEW_BASE\")
Under the hood, it just works using git diff,
git merge-base, and a personal environment variable
REVIEW_BASE.
REVIEW_BASE lets us choose which branch to review
relative to. Most of the time, REVIEW_BASE is
master, but this isn’t always the case! Some repos branch
off of gh-pages. Sometimes I like to review the most recent
commit as if it were its own branch.
To review the code relative so some other base, set
REVIEW_BASE before running git stat:
# Review between 'gh-pages' and the current branch
REVIEW_BASE=gh-pages git stat

# Review changes made by the last commit of this branch:
REVIEW_BASE=HEAD^ git stat
I have export REVIEW_BASE=master in my
~/.bashrc, because most projects branch off of
master.
Nothing too crazy yet—GitHub can already do everything we’ve seen so far. Let’s start to up the ante.
Visualizing file change frequency
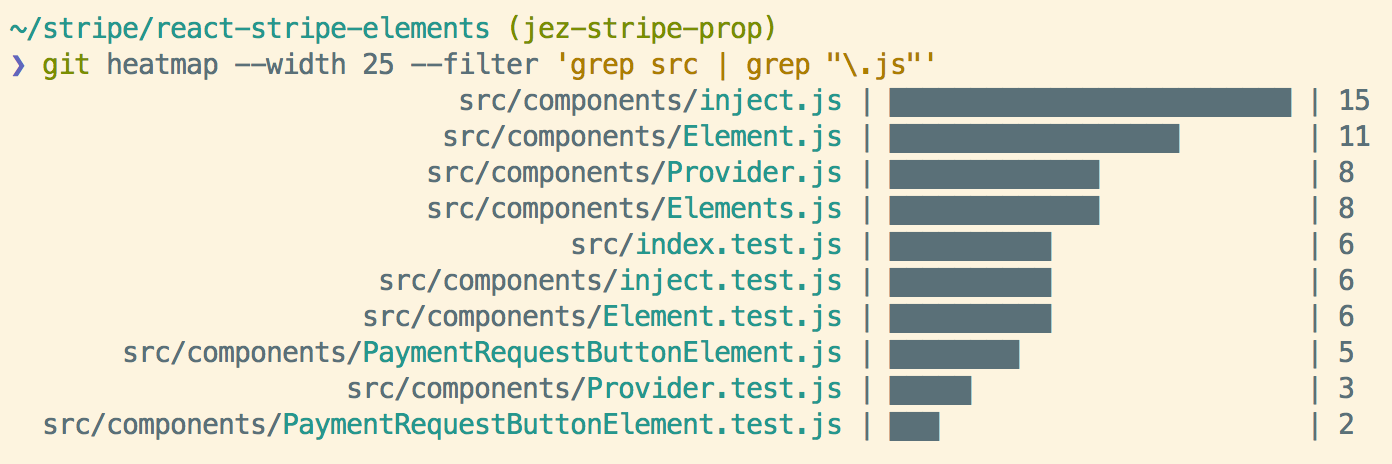
I’ve written a short script that shows me a visualization of how frequently the files involved in this branch change over time:
This command identifies two main things:
Files with lots of changes.
Files that have changed a lot in the past are likely to change in the future. I review these files with an eye towards what the next change will bring.
“Is this change robust enough to still be useful in the future? Will we throw this out soon after merging it?”
Files with few changes.
Files that aren’t changed frequently are more likely to be brittle. Alternatively, it’s often the case that infrequently changed files stay unchanged because the change is better made elsewhere.
“Does this change challenge an implicit assumption so that some other part of the code was relying on? Is there a better place for this change?”
Those two commands (git stat and
git heatmap) are how I kick off my code review: getting a
birds-eye view of the change and some historical context for what I’m
dealing with. Next, I drill down into the relationships between the
files that changed.
Visualizing relationships between files
At work I review JavaScript files, so I’ve built out this next bit of
tooling specifically for JavaScript.The techniques here apply to any language that you can
statically analyze. In particular, I have a rough prototype of
everything JavaScript-specific you see here that works with Standard ML
instead. If you can find me the dependency information for your favorite
language, I’d be happy to help you turn it into a visualization.
It helps to understand which files import others, so I
have a command that computes the dependency graph of the files changed
on this branch:
This is where we start to see some distinct advantages over what
GitHub provides. As you see above, the git depgraph alias
calculates the dependency graph for files changed by this branch. Why is
this useful?
Maybe we want to start reviewing from
Provider.js, since it doesn’t depend on any other files that have changed.Maybe we want to work the other way: start with
Elements.jsso we know the motivation for whyProvider.jshad to changed in the first place.
In either case, we can see the structure of the change. Three files
depend on Elements.js, so it’s serving the needs of many
modules. Element.js only has one dependency, etc. Each
branch’s dependency graph shows different information; it can be
surprising what turns up.
I have the git depgraph alias defined like this:
[alias]
    depgraph = !git madge image --webpack-config webpack.config.js --basedir . --style solarized-dark src
Some notes about this definition:
It depends on the
git-madgecommand, which you can download and install here.It’s using this project’s
webpack.config.jsfile, so I’ve made this alias local to the repo, rather than available globally.It dumps the image to stdout. Above, we used iTerm2’s imgcat program to pipe stdin and dump a raster image to the terminal.
If you don’t use iTerm2 or don’t want to install
imgcat, you can pipe it to Preview using openTheopencommand is macOS-specific. On Linux, you might want to look at thedisplaycommand from ImageMagick.
(open -f -a Preview) or just redirect the PNG to a file.
The git depgraph alias is a game changer. It makes it
easier to get spun up in new code bases, helps make sense of large
changes, and just looks plain cool. But at the end of the day, we came
here to review some code, so let’s take a look at how we can actually
view the diffs of the files that changed.
Reviewing the diffs
To review the diffs, the simplest option is to just run
git diff master..HEAD. This has a bunch of downsides:
No syntax highlighting (everything is either green or red).
No surrounding context (for example, GitHub lets you click to expand lines above or below a diff hunk).
The diff is “unified,” instead of split into two columns.
No way to exclude a specific file (the 300 line diff to your
yarn.lockfile is sometimes nice to hide).
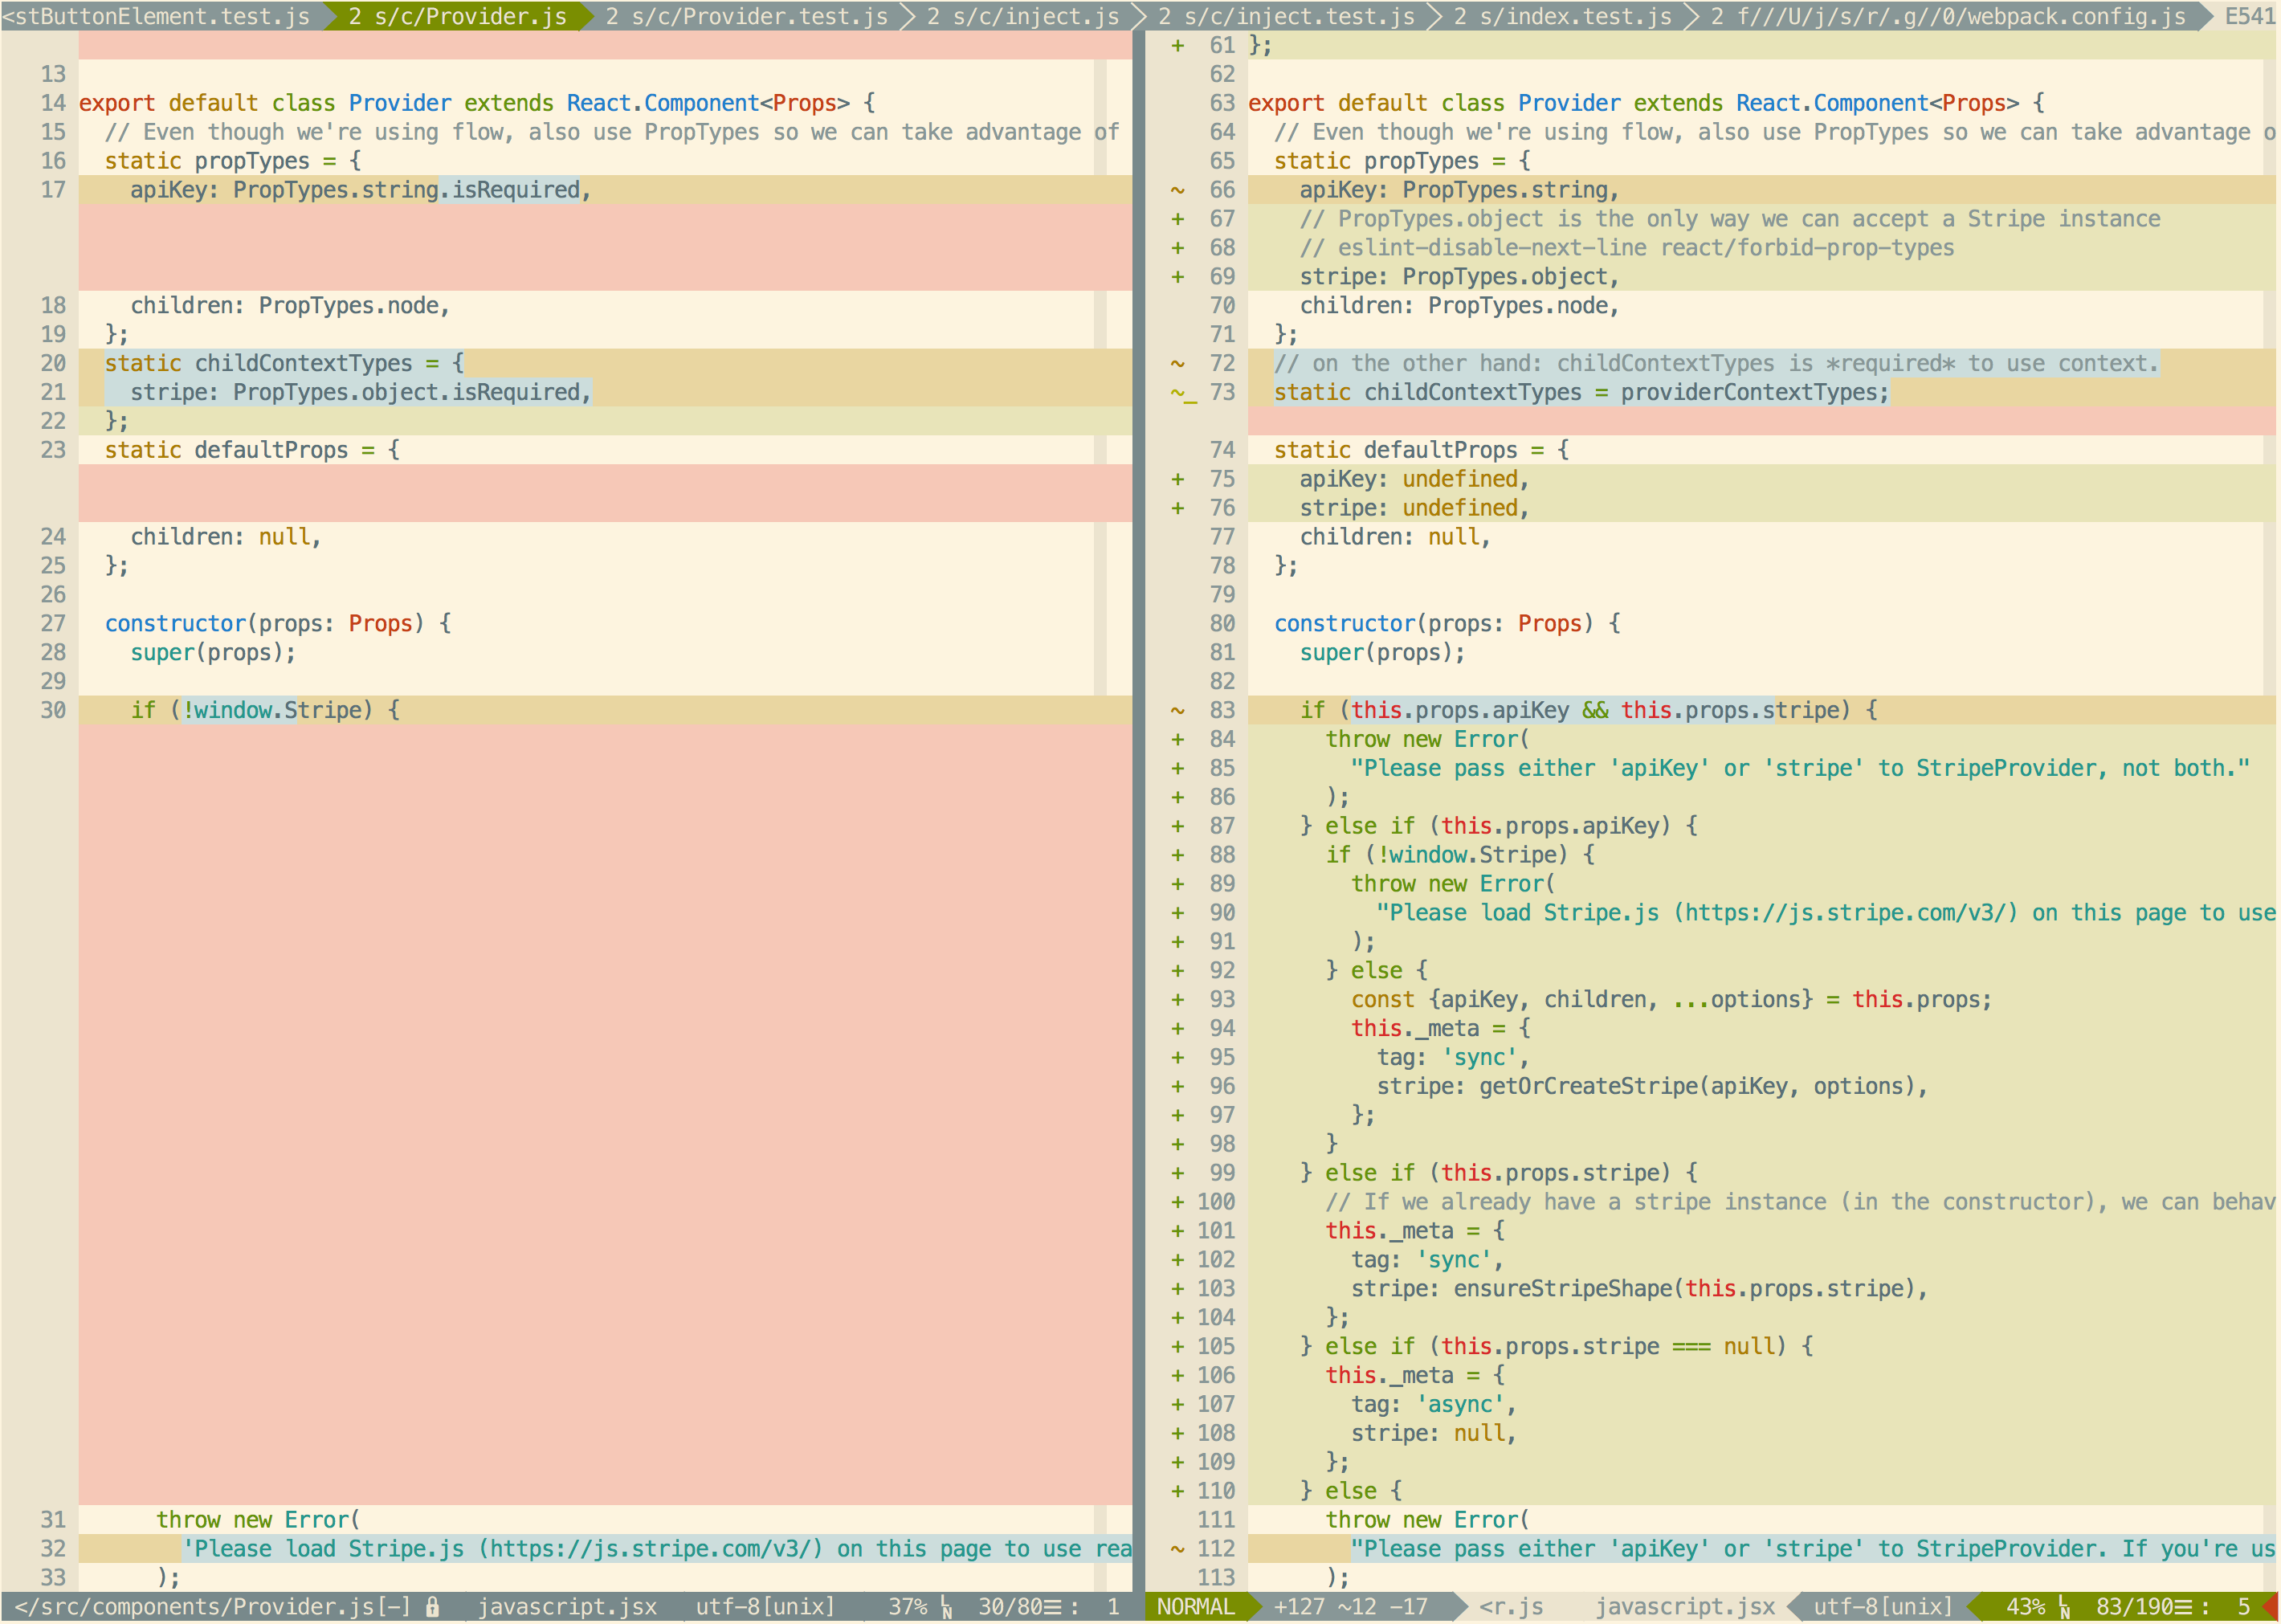
My solution to all of these problems is to view the diffs in Vim, with the help of two Vim plugins and two git aliases. Before we get to that, here’s a screenshot:
Looks pretty similar to GitHub’s interface, with the added bonus that it’s using my favorite colorscheme! The Vim plugins featured are:
- tpope/vim-fugitive for
showing the side-by-side diff (
:Gdiff). - airblade/vim-gitgutter
for showing the
+/-signs. - jez/vim-colors-solarized
for tweaking the diff highlight colors.I’ve patched the default Solarized colors for Vim so
that lines retain their syntax highlighting in the diff mode, while the
backgrounds are highlighted. You can see how this works in this commit:
https://github.com/jez/vim-colors-solarized/commit/bca72cc
And to orchestrate the whole thing, I’ve set up these two aliases:
[alias]
  # NOTE: These aliases depend on the `git files` alias from
  # a few sections ago!

    # Open all files changed since REVIEW_BASE in Vim tabs
    # Then, run fugitive's :Gdiff in each tab, and finally
    # tell vim-gitgutter to show +/- for changes since REVIEW_BASE
    review = !vim -p $(git files) +\"tabdo Gdiff $REVIEW_BASE\" +\"let g:gitgutter_diff_base = '$REVIEW_BASE'\"

    # Same as the above, except specify names of files as arguments,
    # instead of opening all files:
    # git reviewone foo.js bar.js
    reviewone = !vim -p +\"tabdo Gdiff $REVIEW_BASE\" +\"let g:gitgutter_diff_base = '$REVIEW_BASE'\"
Here’s how they work:
git reviewopens each file changed by this branch as a tab in Vim. Then:Gdifffrom vim-fugitive shows the diff in each tab.git reviewoneis likegit review, but you specify which files to open (in case you only want to diff a few).
Like with the git stat alias, these aliases respect the
REVIEW_BASE environment variable I’ve set up in my
~/.bashrc. (Scroll back up for a refresher.) For example,
to review all files relative to master:
REVIEW_BASE=master git reviewAt this point, you might think that all we’ve done is re-create the GitHub code review experience in Vim. But actually what we’ve done is so much more powerful.
Interactive Code Review
When reviewing on GitHub, the code is completely static—you can’t change it. Also, because the code is coming from GitHub’s servers, it’s laggy when you click around to view related files. By switching our code review to the terminal, we can now edit files, jump to other files, and run arbitrary commands at no cost.
It might not be obvious how huge of a win this is, so let’s see some
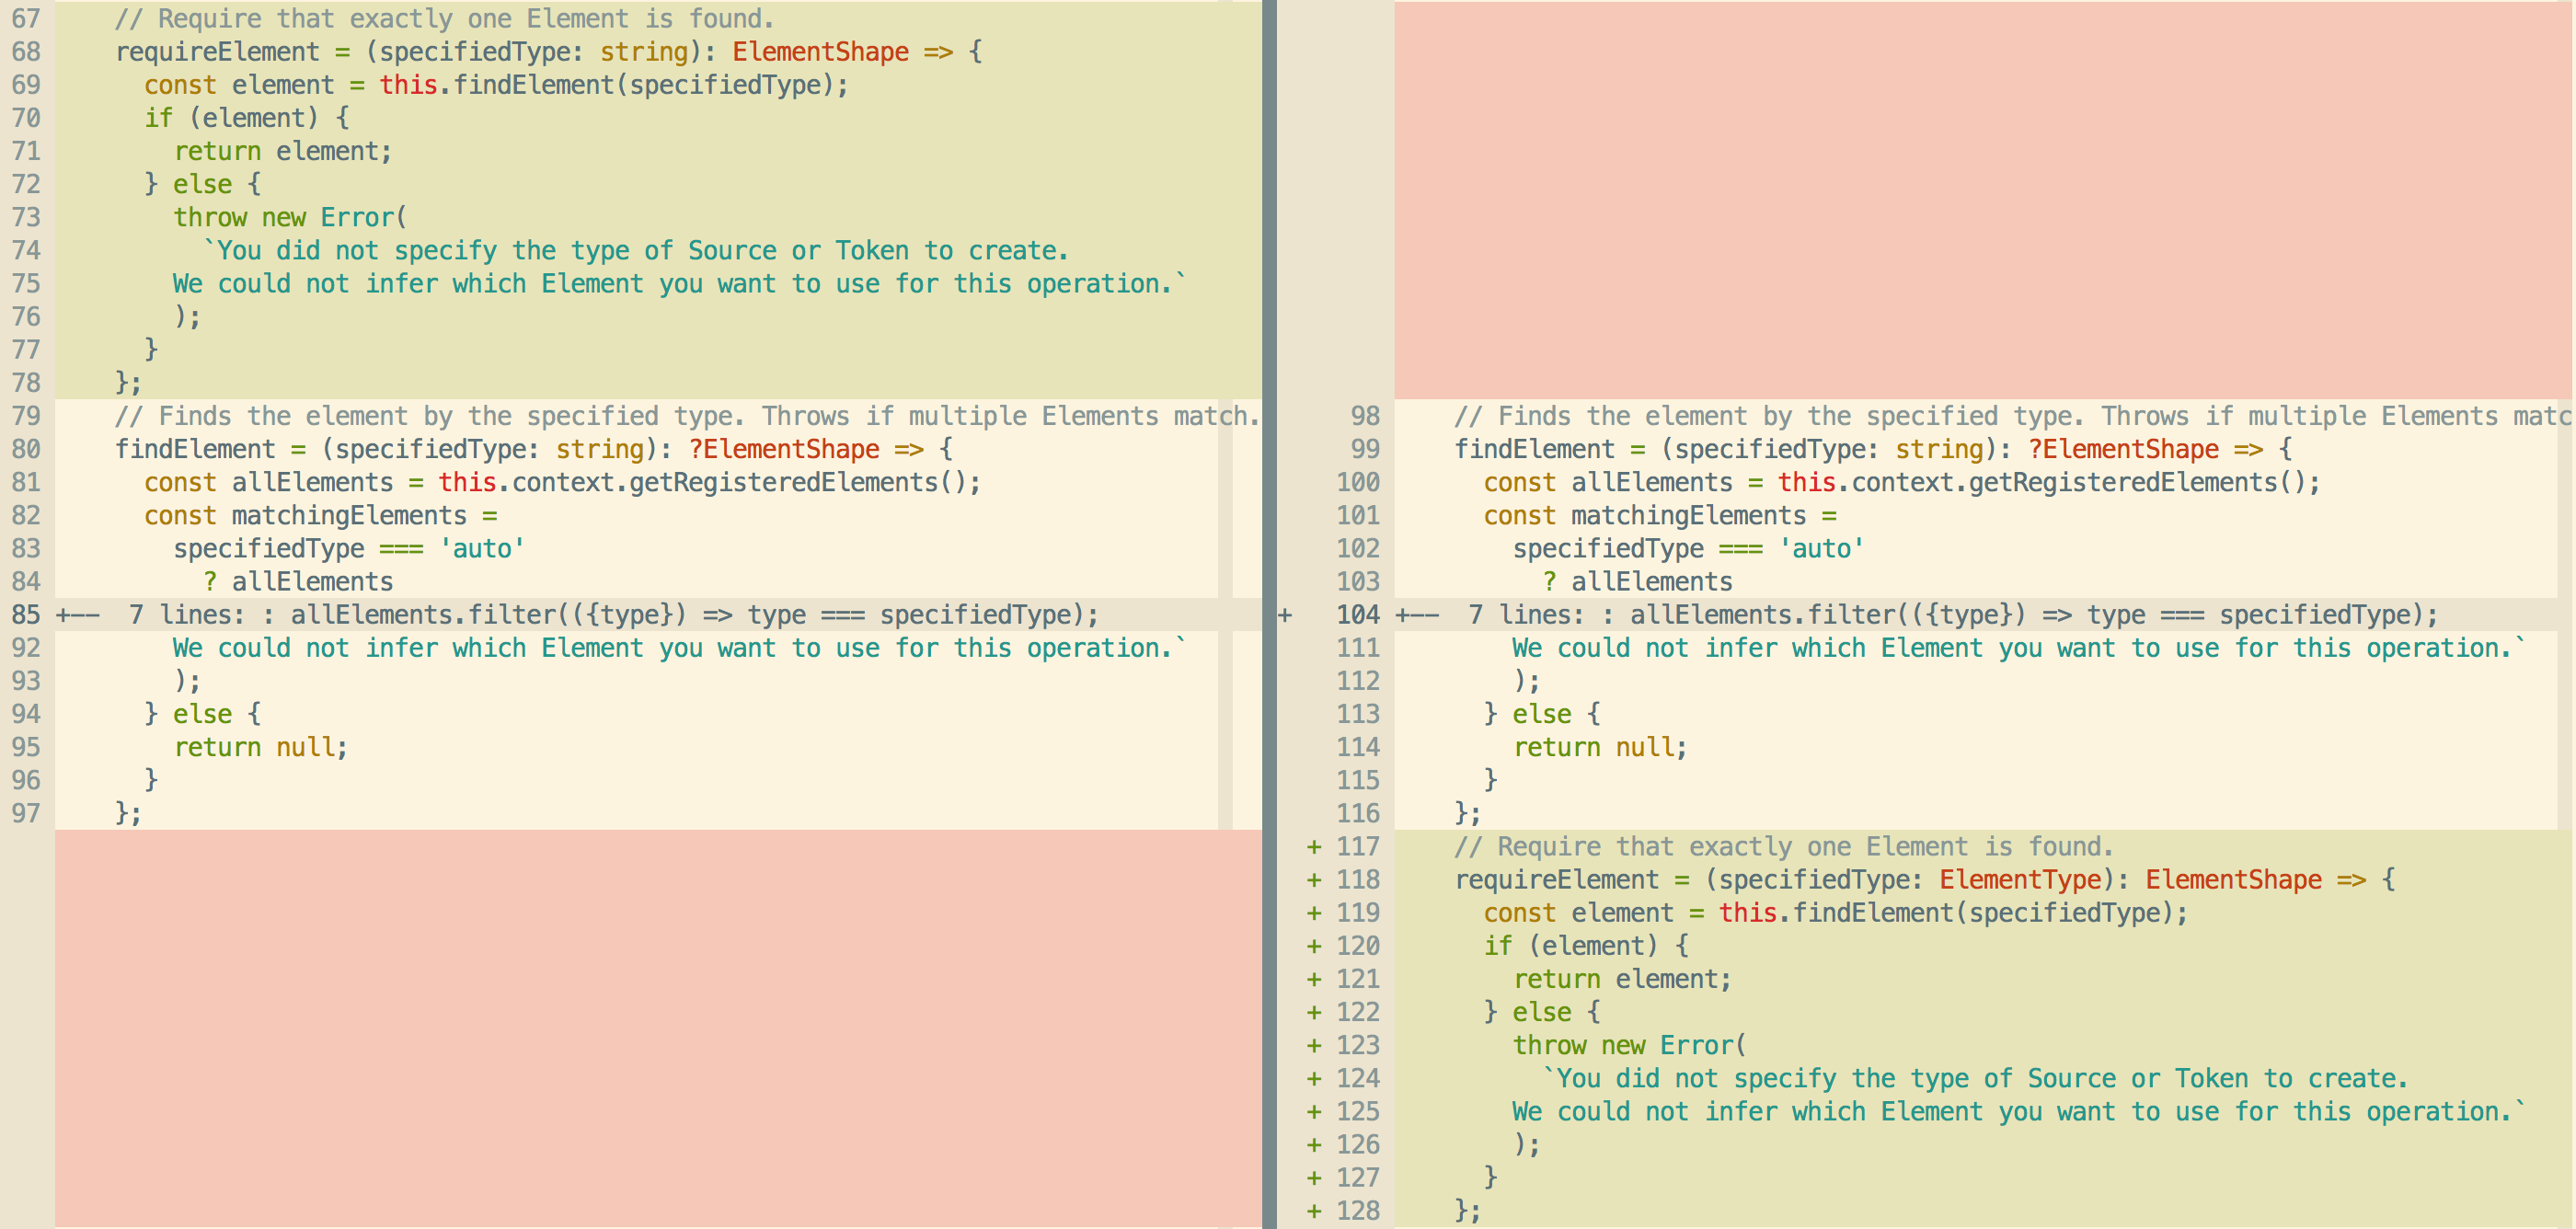
examples. Take this screenshot of the requireElement
function. It moved from above the findElement
function to below it (probably because the former calls the
latter):
But is the location of the requireElement function the
only thing that’s changed? By editing the file to move the function back
to its original location, vim-fugitive will automatically recompute the
diff. And in fact, we can see that the type of the argument has
changed too, from string to ElementType:
If we had been viewing this on GitHub, we might have taken for granted that the function didn’t change. But since we’re in our editor, we can interactively play around with our code and discover things we might have missed otherwise. The advantages of interactive code review go well beyond this example:
In a Flow project, we can ask for the type of a variable.
In a test file, we can change the test and see if it still passes or if it now fails.
We can
grepthe project for all uses of a function (including files not changed by this branch).We can open up related files for cross-referencing.
We can run the code in a debugger and see how it behaves.
By having the full power of our editor, we can literally retrace the steps that the author went through to create the pull request. If our goal is to understand and learn from code review, there’s no better way than walking in the author’s shoes.
Recap
To recap, here’s a list of the tools I use to review code at the command line:
hub pr checkoutgit statto list files that have changedgit heatmapto show how frequently these files changegit depgraphto show a graph of which files depend on whichgit reviewto open diffs of all the files in Vimgit reviewoneto open diffs for a specific handful of files
If you’re having trouble incorporating any of these into your workflow, feel free to reach out and let me know! I’m happy to help.


